|
推荐一个超好用的python包folium, 专门用于地理数据可视化 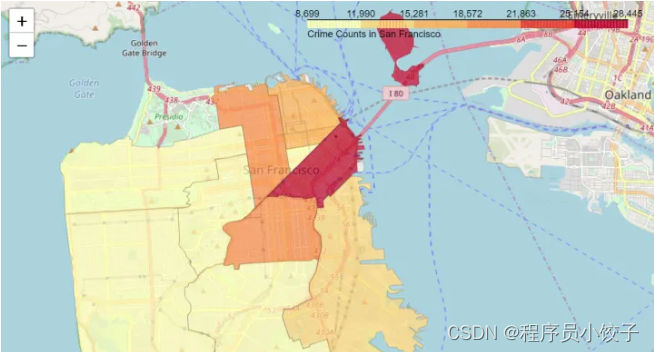
使用方法很简单,操作如下:
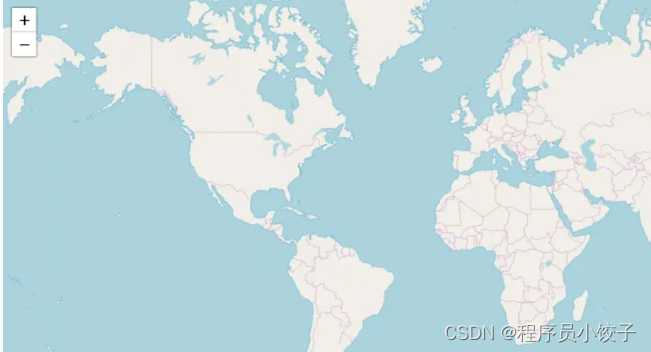
导入包,创建一副世界地图
import folium
import pandas as pd
# define the world map
world_map = folium.Map()
# display world map
world_map
 2. 输入经纬度,尺度,在这里我们以旧金山(37.7749° N, 122.4194° W)为例。 2. 输入经纬度,尺度,在这里我们以旧金山(37.7749° N, 122.4194° W)为例。
# San Francisco latitude and longitude values
latitude = 37.77
longitude = -122.42
# Create map and display it
san_map = folium.Map(location=[latitude, longitude], zoom_start=12)
# Display the map of San Francisco
san_map
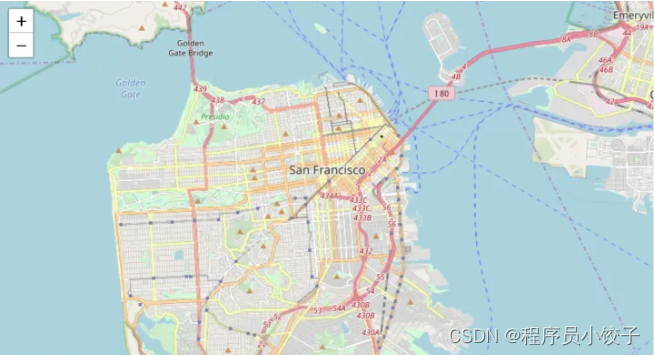
更改地图显示,默认为’OpenStreetMap’风格,我们还可以选择’Stamen Terrain’, 'Stamen Toner’等。
# Create map and display it
san_map = folium.Map(location=[latitude, longitude], zoom_start=12,tiles='Stamen Toner')
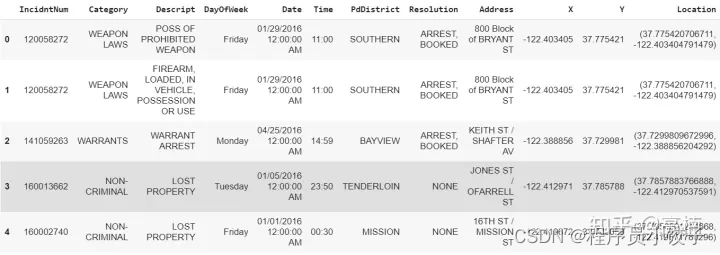
 3. 读取数据集(旧金山犯罪数据集) 3. 读取数据集(旧金山犯罪数据集)
# Read Dataset
cdata = pd.read_csv('https://cocl.us/sanfran_crime_dataset')
cdata.head()
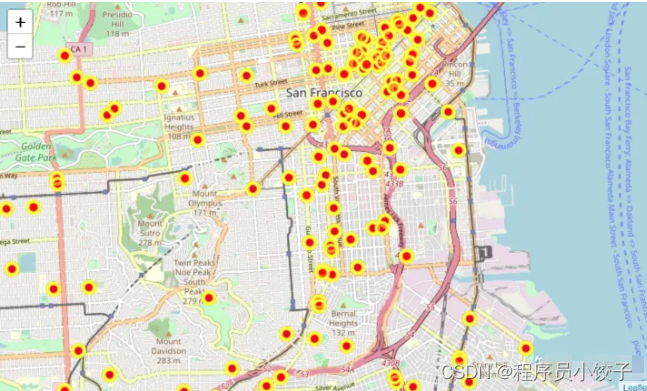
 4. 在地图上显示前200条犯罪数据 4. 在地图上显示前200条犯罪数据
# get the first 200 crimes in the cdata
limit = 200
data = cdata.iloc[0:limit, :]
# Instantiate a feature group for the incidents in the dataframe
incidents = folium.map.FeatureGroup()
# Loop through the 200 crimes and add each to the incidents feature group
for lat, lng, in zip(cdata.Y, data.X):
incidents.add_child(
folium.CircleMarker(
[lat, lng],
radius=7, # define how big you want the circle markers to be
color='yellow',
fill=True,
fill_color='red',
fill_opacity=0.4
)
)
# Add incidents to map
san_map = folium.Map(location=[latitude, longitude], zoom_start=12)
san_map.add_child(incidents)
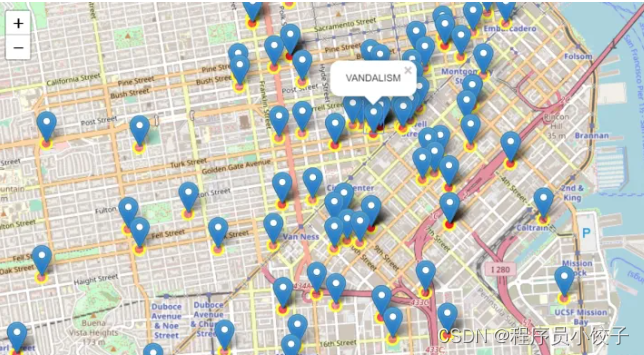
添加地理标签
# add pop-up text to each marker on the map
latitudes = list(data.Y)
longitudes = list(data.X)
labels = list(data.Category)
for lat, lng, label in zip(latitudes, longitudes, labels):
folium.Marker([lat, lng], popup=label).add_to(san_map)
# add incidents to map
san_map.add_child(incidents)
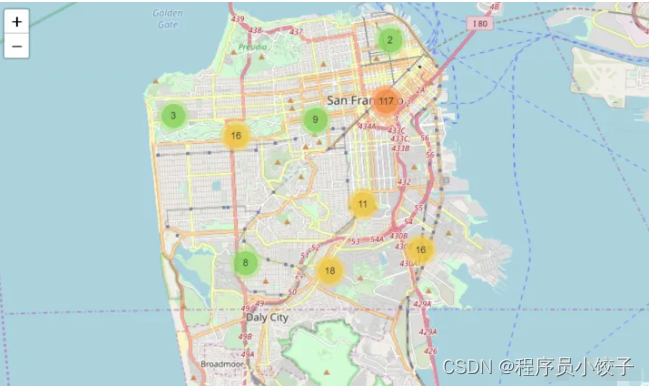
 6. 统计区域犯罪总数from folium import plugins 6. 统计区域犯罪总数from folium import plugins
# let's start again with a clean copy of the map of San Francisco
san_map = folium.Map(location = [latitude, longitude], zoom_start = 12)
# instantiate a mark cluster object for the incidents in the dataframe
incidents = plugins.MarkerCluster().add_to(san_map)
# loop through the dataframe and add each data point to the mark cluster
for lat, lng, label, in zip(data.Y, data.X, cdata.Category):
folium.Marker(
location=[lat, lng],
icon=None,
popup=label,
).add_to(incidents)
# add incidents to map
san_map.add_child(incidents)
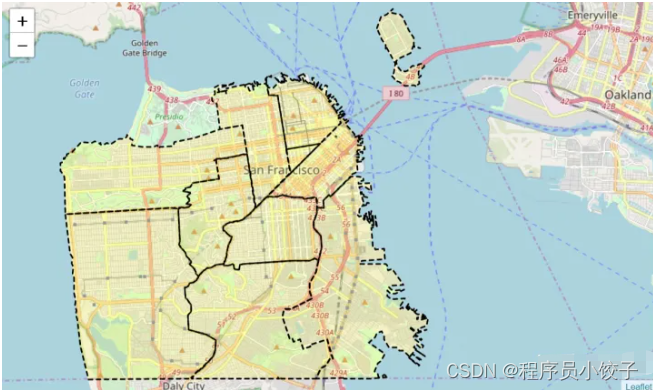
 7. 读取geojson文件,可视化旧金山市10个不同Neighborhood的边界import json 7. 读取geojson文件,可视化旧金山市10个不同Neighborhood的边界import json
import requests
url = 'https://cocl.us/sanfran_geojson'
san_geo = f'{url}'
san_map = folium.Map(location=[37.77, -122.4], zoom_start=12)
folium.GeoJson(
san_geo,
style_function=lambda feature: {
'fillColor': '#ffff00',
'color': 'black',
'weight': 2,
'dashArray': '5, 5'
}
).add_to(san_map)
#display map
san_map
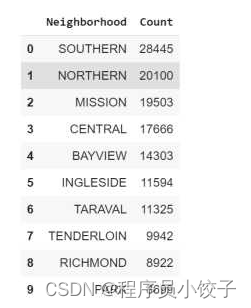
统计每个区域的犯罪事件数目# Count crime numbers in each neighborhood
disdata = pd.DataFrame(cdata['PdDistrict'].value_counts())
disdata.reset_index(inplace=True)
disdata.rename(columns={'index':'Neighborhood','PdDistrict':'Count'},inplace=True)
disdata
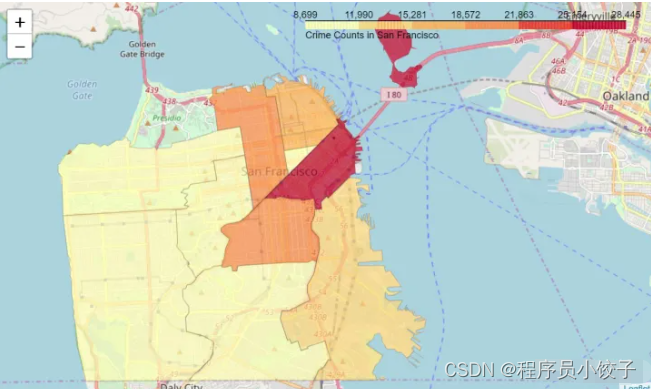
 9. 创建Choropleth Map (颜色深浅代表各区犯罪事件数目) 9. 创建Choropleth Map (颜色深浅代表各区犯罪事件数目)
m = folium.Map(location=[37.77, -122.4], zoom_start=12)
folium.Choropleth(
geo_data=san_geo,
data=disdata,
columns=['Neighborhood','Count'],
key_on='feature.properties.DISTRICT',
#fill_color='red',
fill_color='YlOrRd',
fill_opacity=0.7,
line_opacity=0.2,
highlight=True,
legend_name='Crime Counts in San Francisco'
).add_to(m)
m
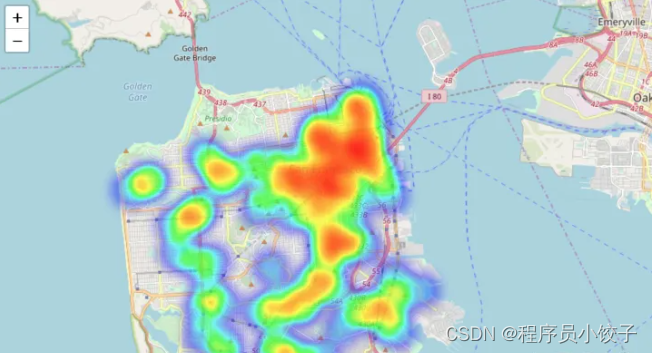
 10. 创建热力图 10. 创建热力图
from folium.plugins import HeatMap
# let's start again with a clean copy of the map of San Francisco
san_map = folium.Map(location = [latitude, longitude], zoom_start = 12)
# Convert data format
heatdata = data[['Y','X']].values.tolist()
# add incidents to map
HeatMap(heatdata).add_to(san_map)
san_map
最后:关于Python技术储备
学好 Python 不论是就业还是做副业赚钱都不错,但要学会 Python 还是要有一个学习规划。最后大家分享一份全套的 Python 学习资料,给那些想学习 Python 的小伙伴们一点帮助!
朋友们如果需要这份完整的资料可以微信扫描下方CSDN官方认证二维码免费领取【保证100%免费】
 一、Python所有方向的学习路线
Python所有方向的技术点做的整理,形成各个领域的知识点汇总,它的用处就在于,你可以按照上面的知识点去找对应的学习资源,保证自己学得较为全面。 
二、Python必备开发工具
三、精品Python学习书籍
当我学到一定基础,有自己的理解能力的时候,会去阅读一些前辈整理的书籍或者手写的笔记资料,这些笔记详细记载了他们对一些技术点的理解,这些理解是比较独到,可以学到不一样的思路。 
四、Python视频合集
观看零基础学习视频,看视频学习是最快捷也是最有效果的方式,跟着视频中老师的思路,从基础到深入,还是很容易入门的。 
五、实战案例
光学理论是没用的,要学会跟着一起敲,要动手实操,才能将自己的所学运用到实际当中去,这时候可以搞点实战案例来学习。
六、Python练习题
检查学习结果。 
七、面试资料
我们学习Python必然是为了找到高薪的工作,下面这些面试题是来自阿里、腾讯、字节等一线互联网大厂最新的面试资料,并且有阿里大佬给出了权威的解答,刷完这一套面试资料相信大家都能找到满意的工作。   最后,千万别辜负自己当时开始的一腔热血,一起变强大变优秀。 最后,千万别辜负自己当时开始的一腔热血,一起变强大变优秀。
|